Depths of Wikipedia & transit syntax
April 24, 2023
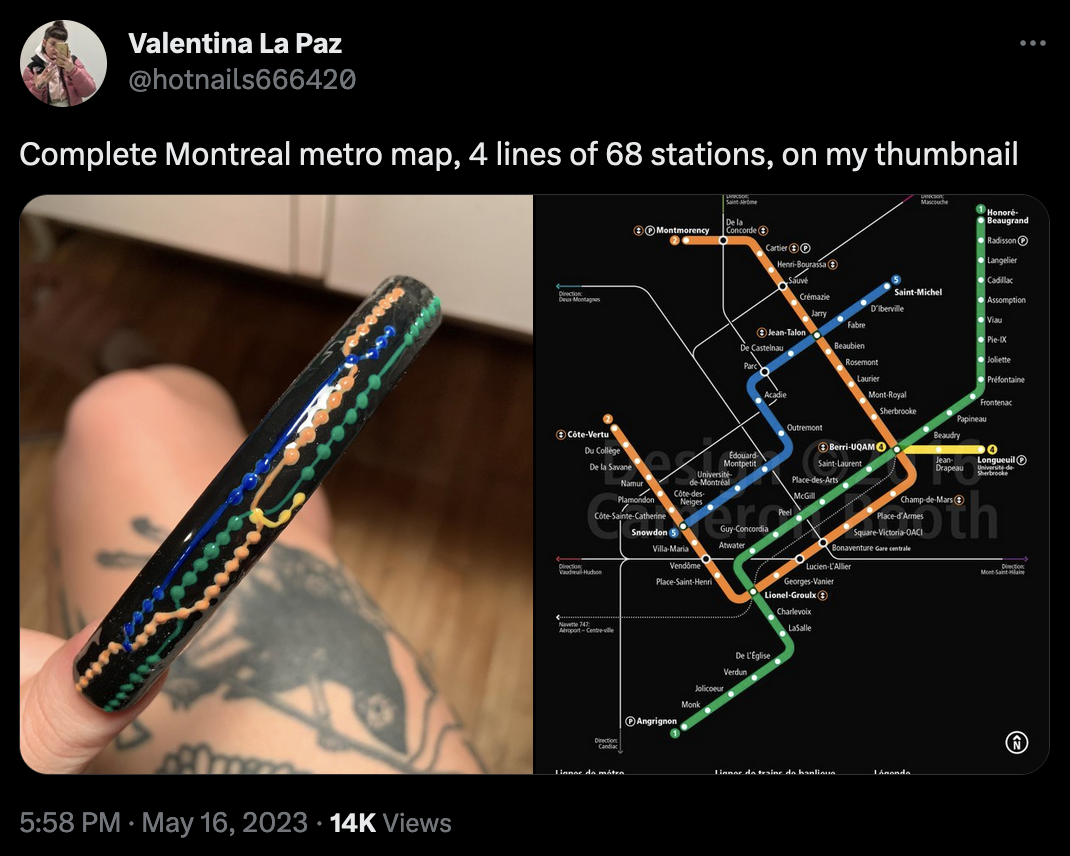
Updated May 17, 2023: I had a ton of fun this weekend joining Annie Rauwerda (aka @depthsofwikipedia) as a guest for the Montréal stop of her live tour. I spoke a bit about my work on local Wikipedia – like the article on Snow removal in Montreal and the Montreal Metro route diagram (and my brush with craziness by means of art and NFTs last year).
It was a ton of fun! Annie’s show is fantastic: It covers some of the wackiest Wikipedia articles rapid-fire (and has the best parody of “We Didn’t Start a Fire” I’ve heard). Thank you to Annie for the invite! And of course for anyone who hasn’t seen Annie’s work, make sure to go follow Depths of Wikipedia on all the social medias. It’s a wonderful account.

Something I presented briefly during the show was how route diagrams work on Wikipedia. Earlier this year, I built a metro route diagram for the Montréal metro system (you can see it live in the article for the Montreal metro’s infobox; it’s under the “System map” header) – it was a ton of fun. And uncovered plenty of interesting subtleties in the context of both metro map design in general and information distribution on Wikipedia.
Route diagrams look like this:
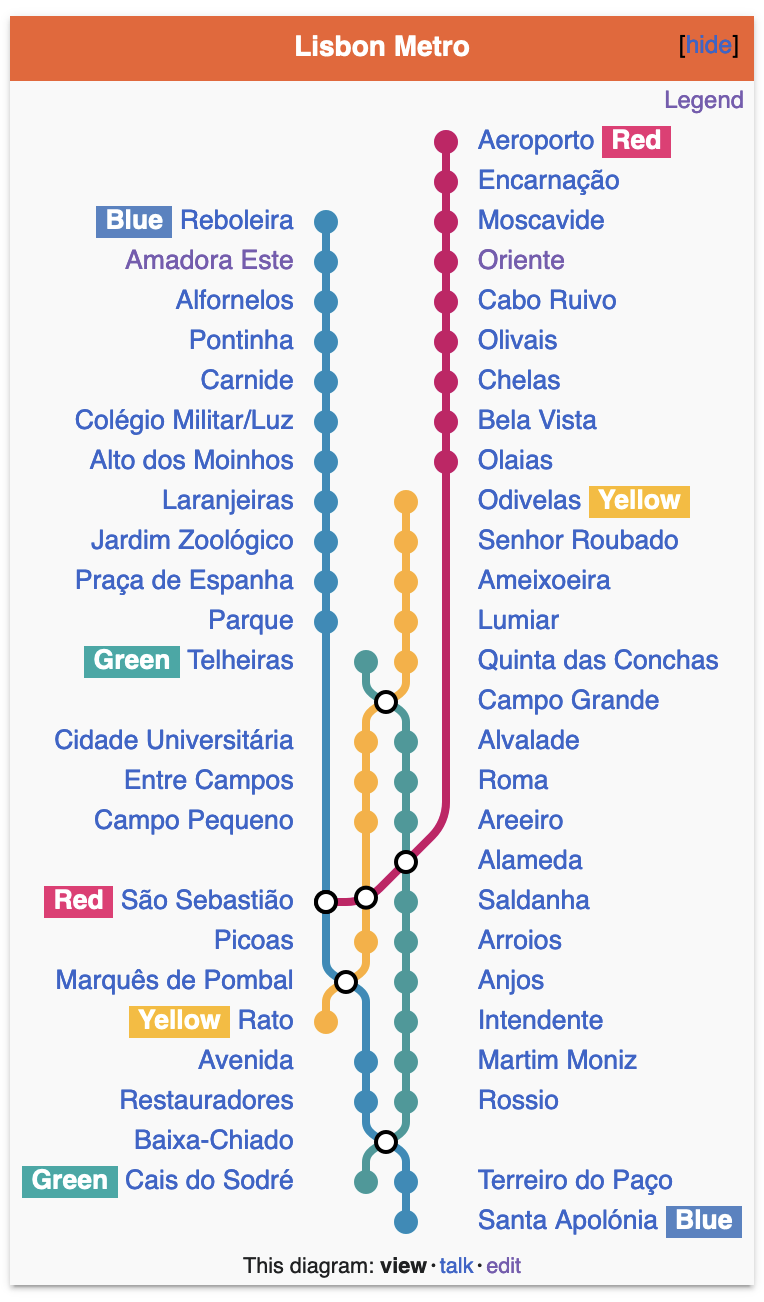
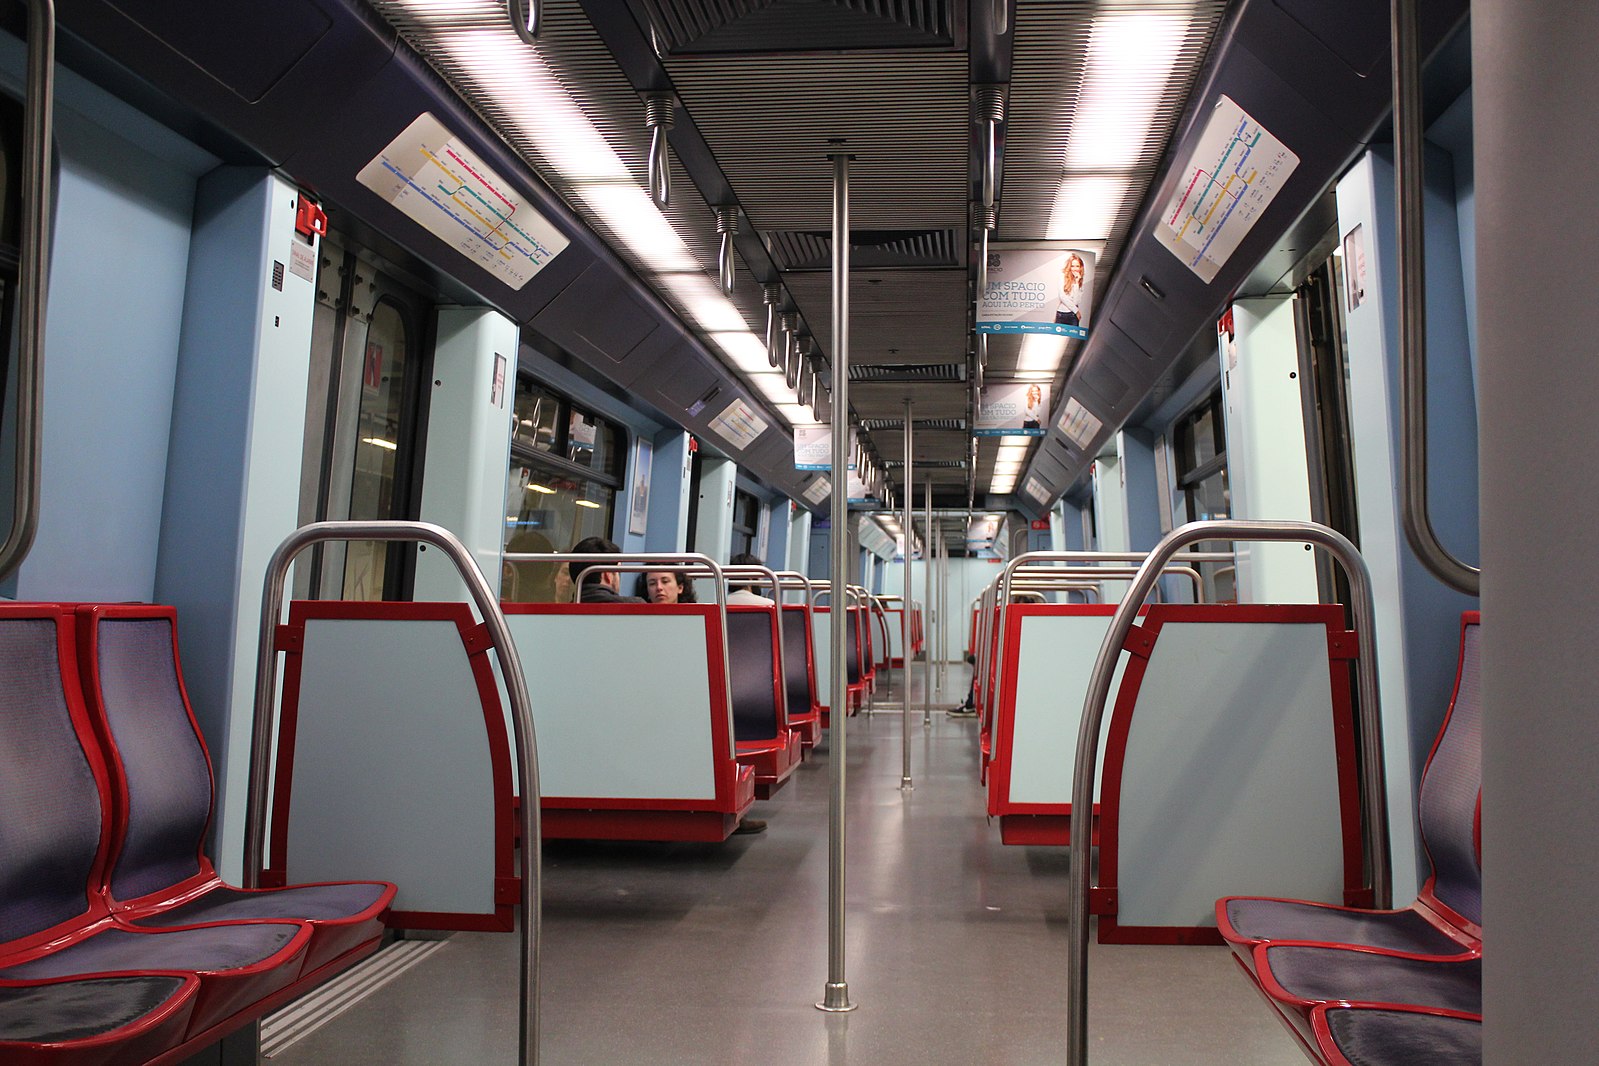
This is the Lisbon metro’s route diagram, as created by Wikipedia editors. This route diagram is constructed using the vector symbols from Wikipedia and a custom syntax (more on that later), but is based quite literally off of a diagram that appears in Lisbon’s metro cars. These kinds of diagrams are interesting to me because they don’t have much geographical data, and they’re useful primarily when space is a concern: You’ll often see them in real-life on the sliver of ceiling in a metro car above the doors. Of course, the benefit of compressed size also makes them an excellent visual aid in Wikipedia infoboxes.
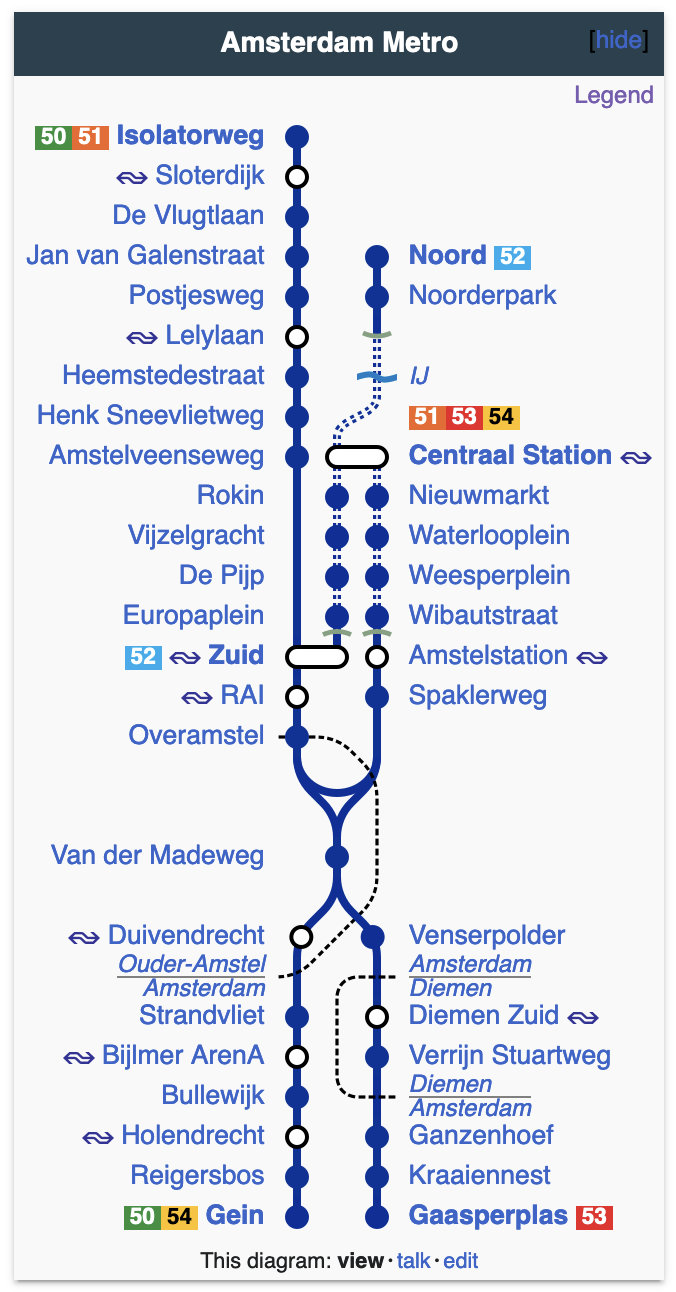
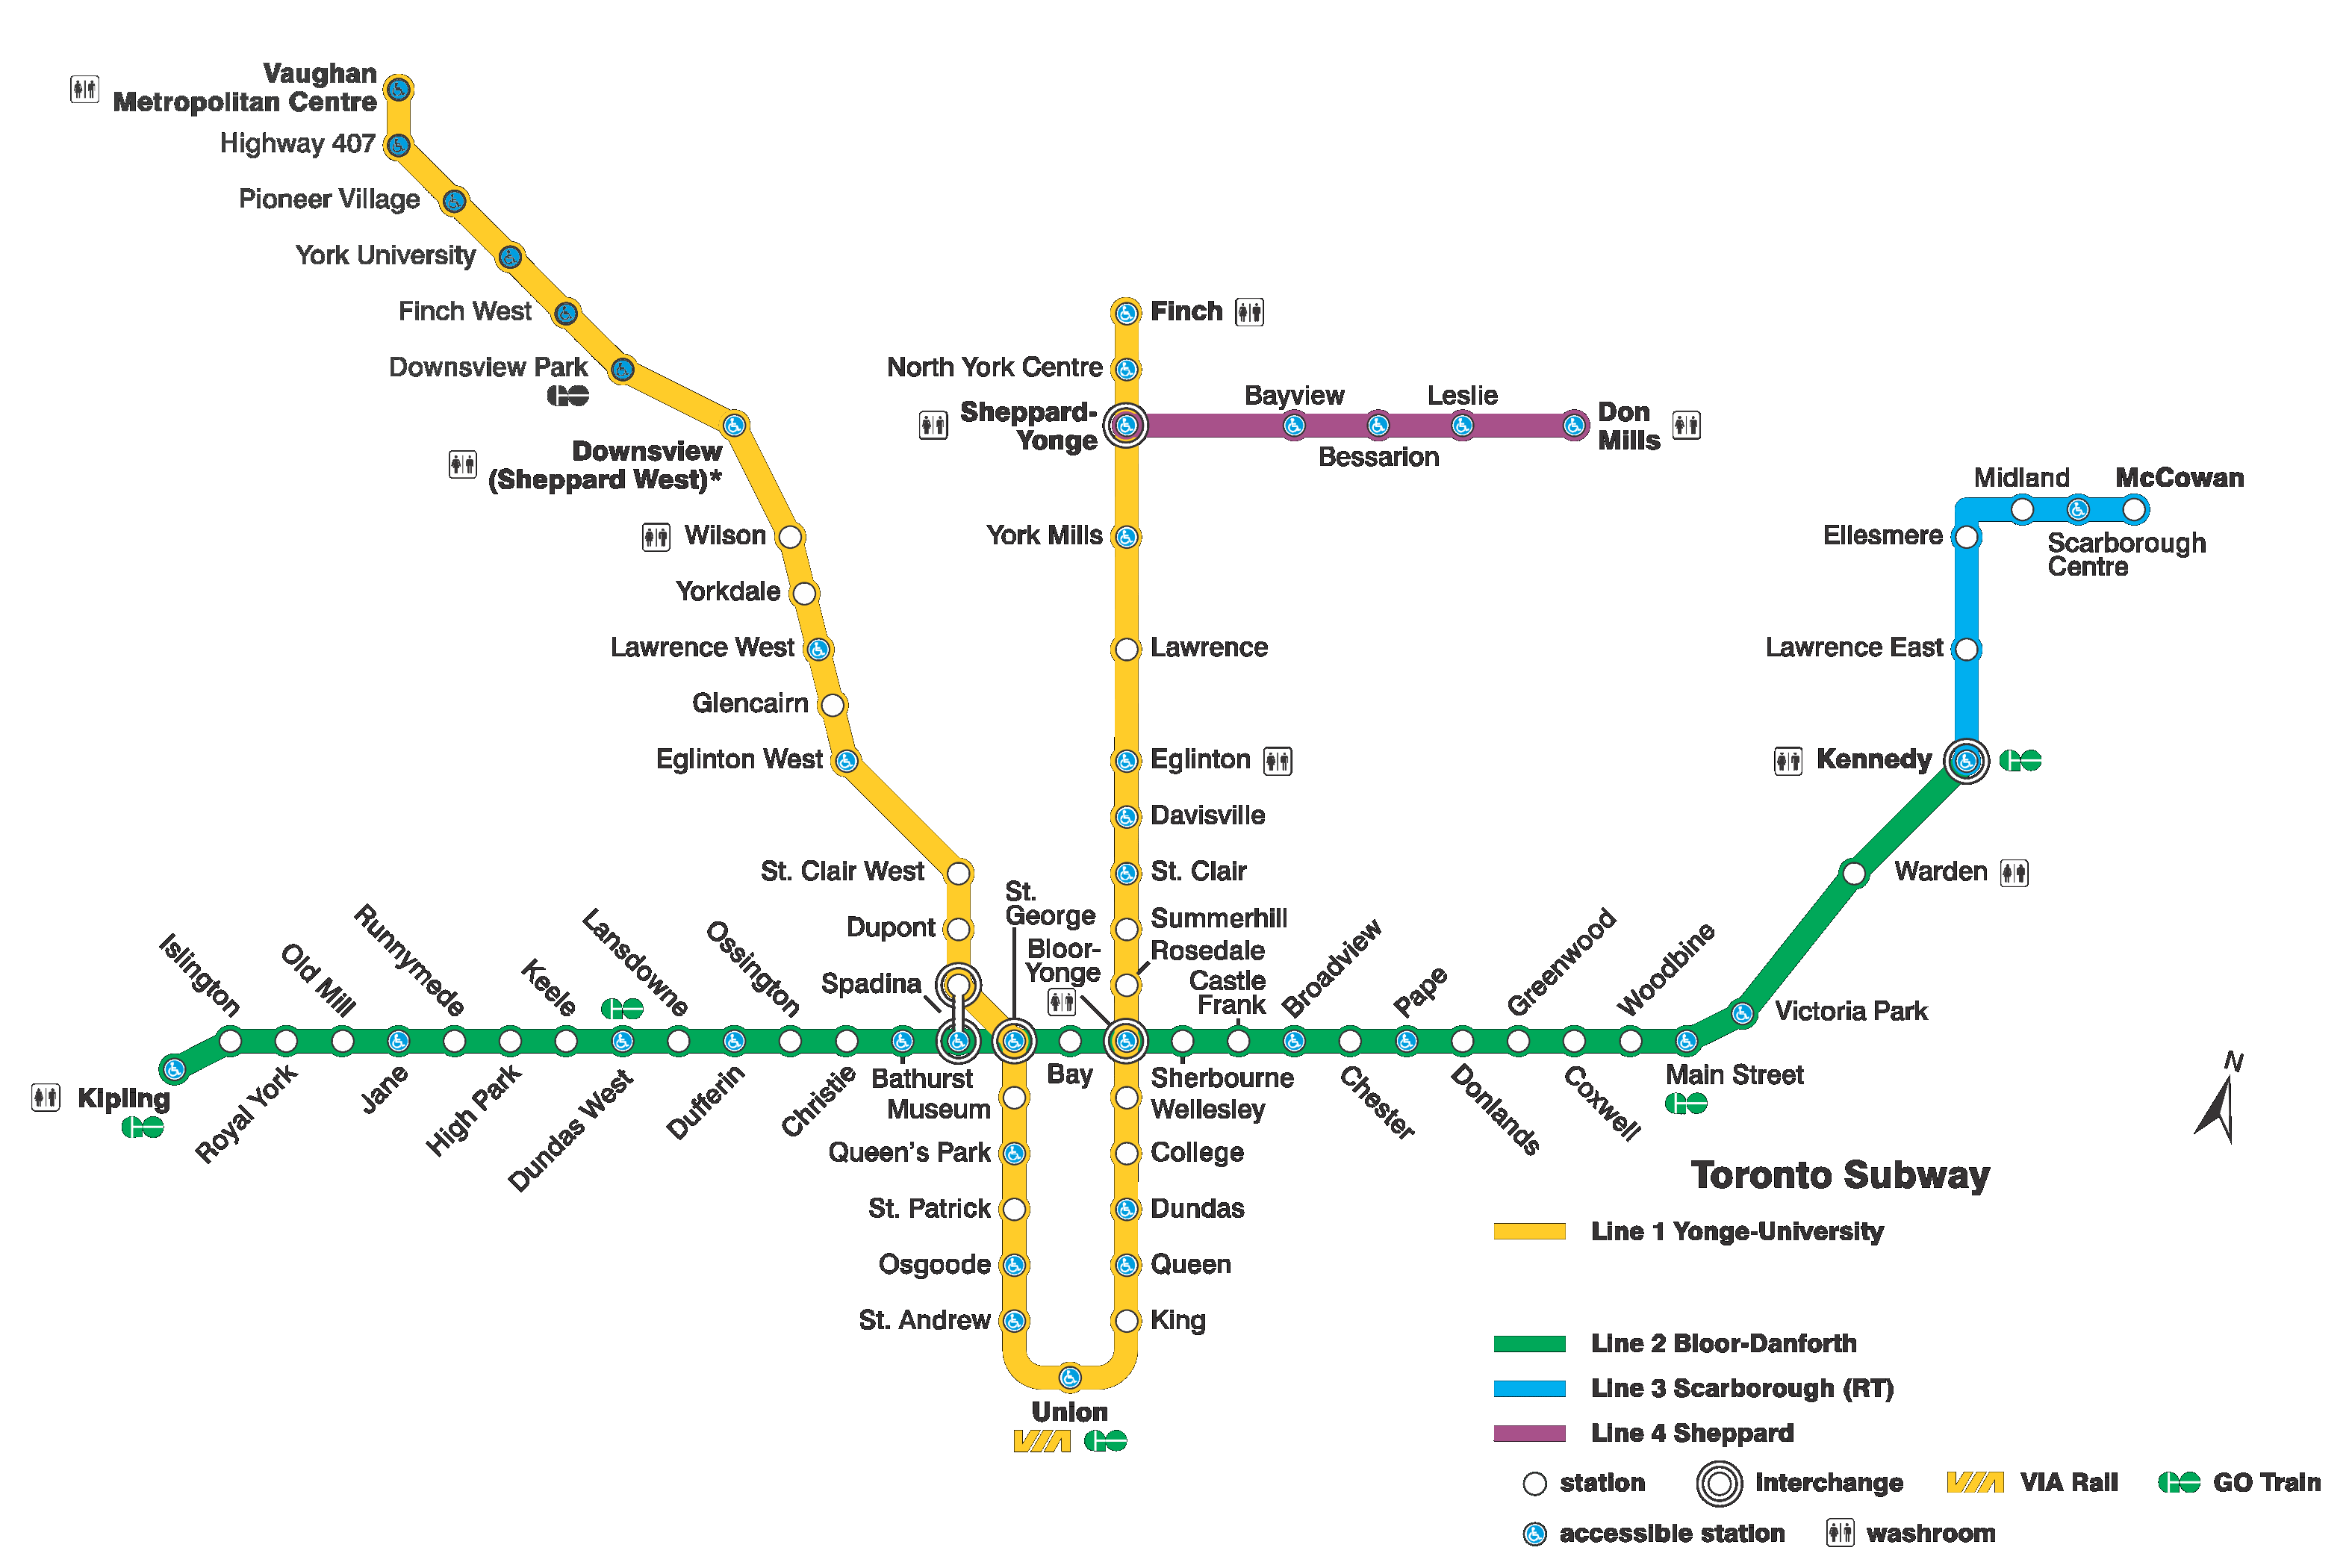
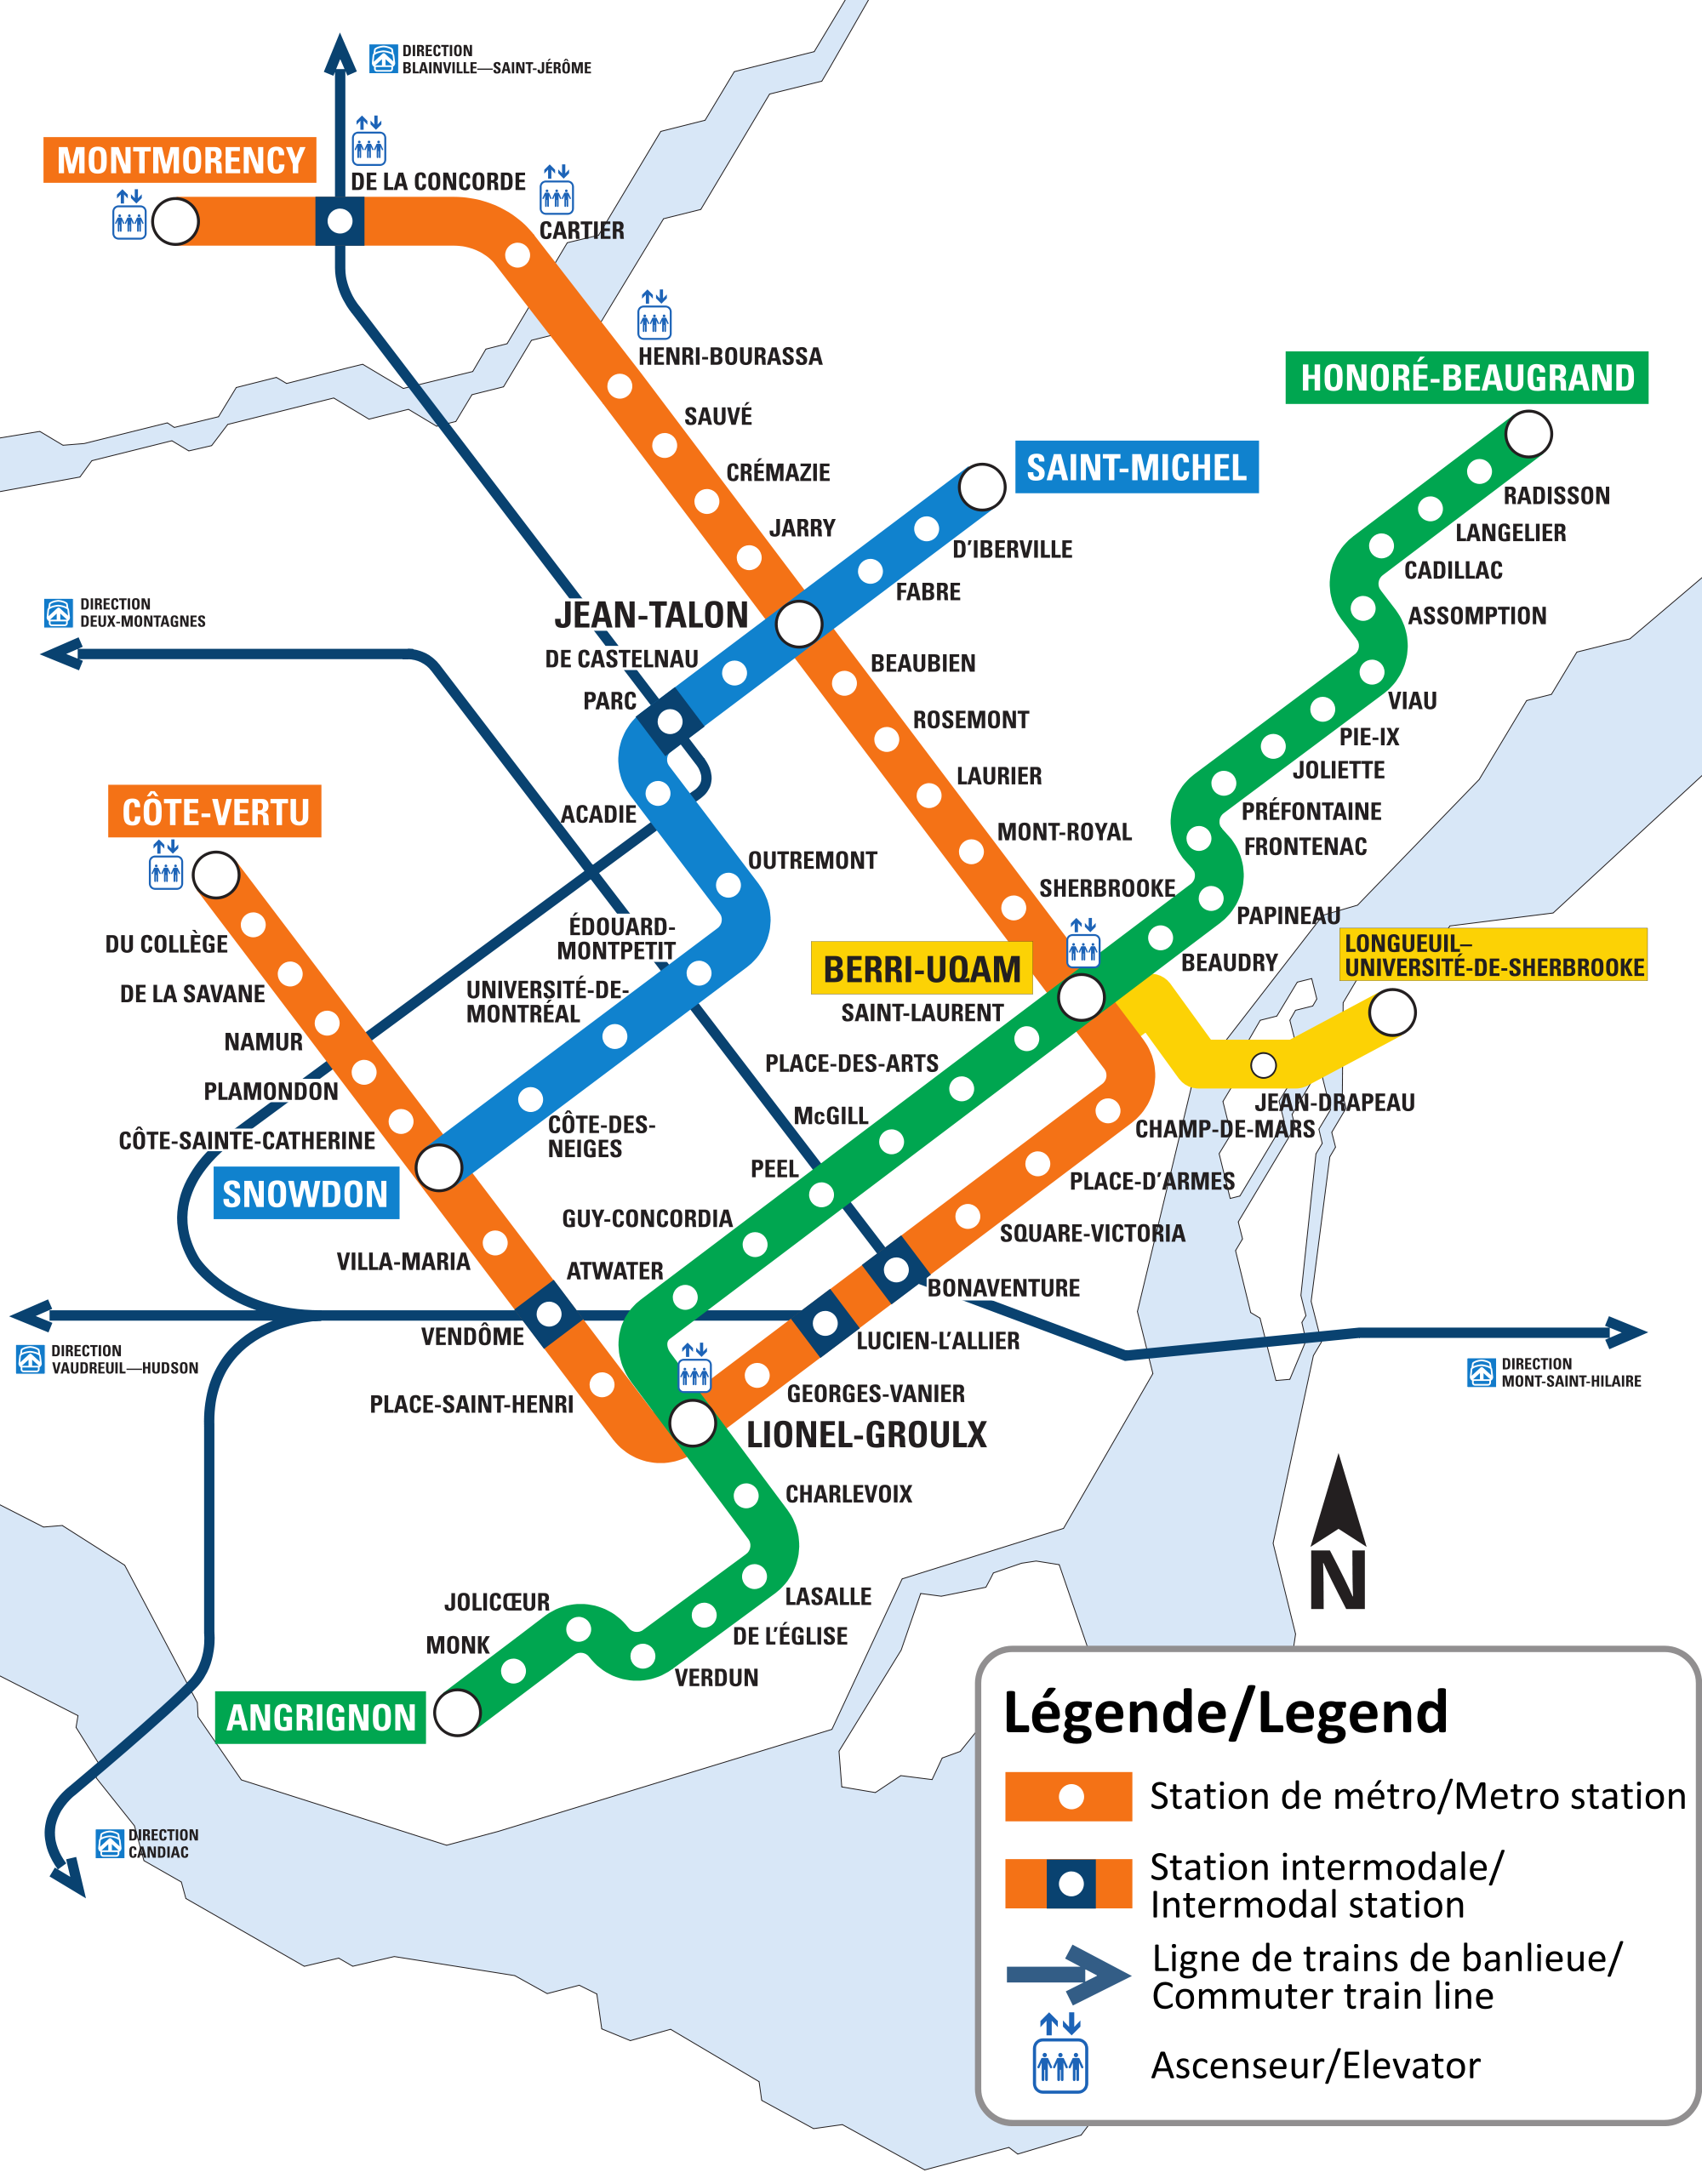
In the real world, many metro systems avoid this kind of diagram entirely in favor of a more traditional kind of metro diagram, where the route is flattened into 90º turns and perfect straightaways, but the broad strokes of system geography are kept intact (Lisbon uses both, but most people are probably more familiar with traditional diagrams overlaid over simplified geography).
Nearly any transit systems can be represented using a flattened diagram, and it’s a very lucid way to present complete and concise information about the stations, intersections, and terminuses in a metro system.
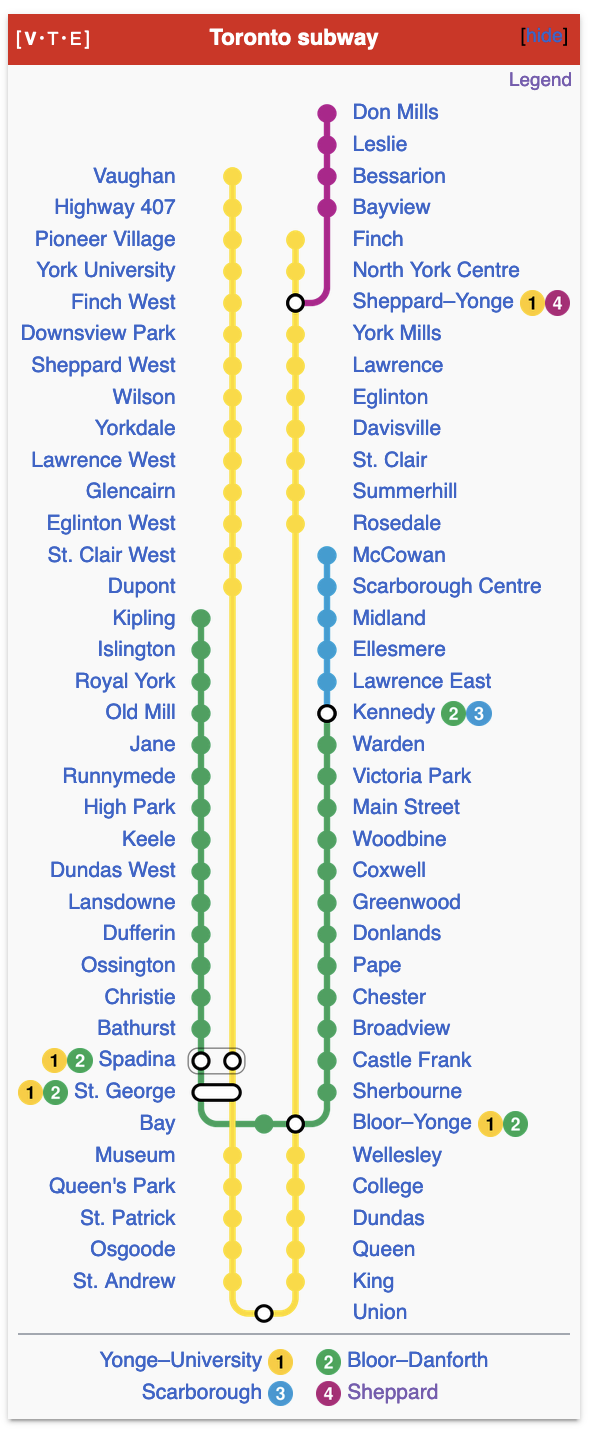
The actual nodes and symbols that make up most metro diagrams on Wikipedia – terminuses, transfers, straights – are pretty universal. In fact, often this format is used for subject matter completely unrelated to transit (thanks to Annie for showing me this one):

The syntax that makes up these diagrams is probably one of the more arcane mechanics on Wikipedia I’ve stumbled across.
A complete routemap is built using markup like this (brace yourself):
KBHFa~~ ~~London~~United Kingdom
TUNNEL1W~~ ~~ ~~ ~~Channel Tunnel
\ABZgl+l\STR+r
France~~Paris~~ ! !\BHF\BHF~~ ~~Brussels~~Belgium
Portugal~~Lisbon~~ ! !KBHFa\STR\BHF~~ ~~Amsterdam~~Netherlands
Spain~~Madrid~~ ! !BHF\STR\STR
ABZl+l\KRZlr+lr\ABZg+r
tSTRa\BHF\STR~~ ~~Bern~~Switzerland
Italy~~Rome~~ ! !tKBHFe!~STRc2\BHF3!~STRc2\ABZg3~~ ~~Vienna~~Austria
Hungary~~Budapest~~ ! !BHF+1\STR+1+c4\STRc4!~tSTRa
Romania~~Bucharest~~ ! !BHF\BHF!~HUBaq\tBHF!~HUBeq~~ ~~Berlin~~Germany
Ukraine~~Kyiv~~ ! !BHF\STR\tBHF~~ ~~Copenhagen~~Denmark
Poland~~Warsaw~~ ! !STR\BHF\tSTRe
Belarus~~Minsk~~ ! !STR+c2\BHF3\hKRZWae~~Øresund/Öresund
ABZg+1\STR+l!~STRc4\ABZgr+r
Sweden~~Stockholm~~ ! !STR\KBHFe\KBHFe~~ ~~Oslo~~Norway
STR\BOOT\~~ ~~ ~~ ~~Baltic Sea
STR\KBHFa\~~ ~~Helsinki~~Finland
bSHI2+lr\
BHF\~~ ~~Moscow~~Russia
BHF\~~ ~~Nur-Sultan~~Kazakhstan
BHF\~~ ~~Beijing~~China
BHF\~~ ~~Pyongyang~~North Korea
BHF\~~ ~~Seoul~~South Korea
TRAJEKT\~~ ~~ ~~ ~~Korea Strait
KBHFe\~~ ~~Tokyo~~Japan
This renders into something that looks like this:
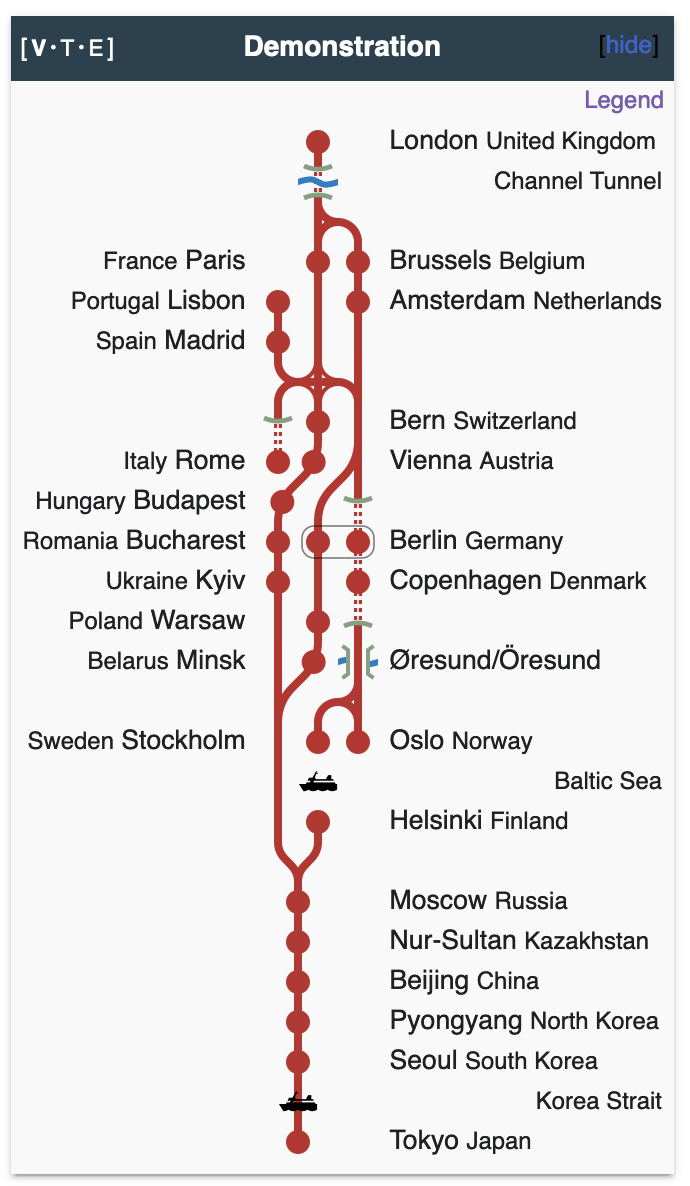
What the hell is going on here? It’s actually not as bad as it looks. BSicon on Wikimedia Commons is the engine powering all of these diagrams. It’s a system that’s been around since 2006, and I’ll let its Wikimeda page provide the introduction (bold text is my own):
“BSicons are a series of standardized SVG icons. The name is derived from the German Bahnstrecken (“railway lines”). While the icons were originally used to create diagrams for railways, they have also been adopted for illustrating canals, footpaths and motorways.
“After testing and discussion on the German Wikipedia, the first BSicons on Commons were uploaded by Bernina on 30 September 2006. As of 19 May 2021, there are 298,248 BSicons.
Unsurprisingly, the breadth of iconography captured by BSicon means that using the system is incredibly terse but deeply expressive. Every line of a route diagram is pointing declaratively to named icons from the catalog, where tildes seperate “columns” of the route diagram and backslashes allow you to “skip” a column. By concatanating a set of icon names, tildes, and backslashes, you end up with a row of symbols… and by adding row upon row, you can create a complete route diagram.
Most or all route diagram on Wikipedia are built in this way, and largely it’s work done by hand by Wikipedia editors. I’d encourage taking a look at the source if and when you stumble on one of these diagrams, just to see what’s going on under the hood.

There are many other ways to build a system diagram, and plenty of very clever automated systems. System diagraming is important for modern mapping software you likely use everyday life. Transit, an app which provides real-time public transit data, designed a system for automatically generating geographic route diagrams on top of real maps (you can read more about that in their fascinating blog post on the subject). This method differs from the other behemoths in the space (like Apple Maps) who build every new transit diagram by hand.
So how does this all connect back to what I’ve been working on?
After visiting Lisbon earlier this year, I was pretty excited by their flattened route diagram: Montreal does not have one, but we do have a beloved traditional metro diagram.
I spent some time putting together a flattened route diagram for the Montreal metro on Wikipedia – and pretty soon other editors joined the fray. It has evolved into a pretty compelling system map:
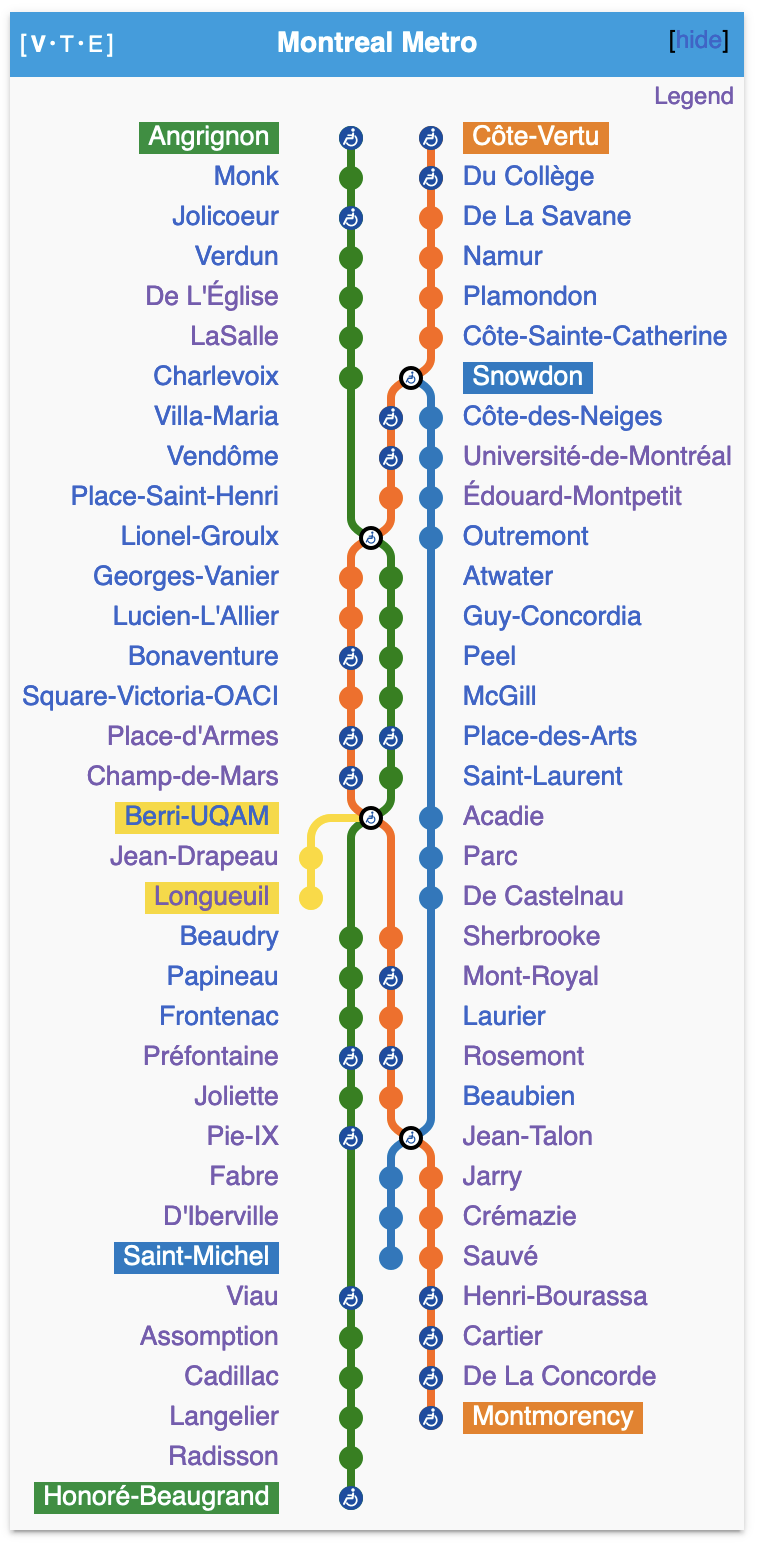
I love the way it’s turned out. If you look at it on its side, you can make out the shape of the geographic system diagram, where the orange line makes a big U as it intersects with the other three lines. The right side represents the northern end of the system, the left side represents the southern end of the system… It’s surprisingly familiar.
Wikipedia is a tertiary source of information, where verifiability is a core tenent. But as a consequence of some combination of the sheer popularity of Wikipedia, ease of modifying it, and the necessity of organization, Wikipedia sometimes introduces novel ideas, either deliberately or by accident.
For example, the idea of video game “console generations” is a construct stemming largely from Wikipedia. Wikipedia “has been noted for creating its own version of console generation definitions that differ from other academic sources, [where] the definitions from Wikipedia [have] been adopted by other sources but without having any true rationale behind it” (from “Home video game console generations”). The popular “generations” you may have heard of are all but made up. Despite this, in nearly any article on a video game console, you’ll see its “generation” noted – even with no external consensus on which consoles fit into which “generation”.
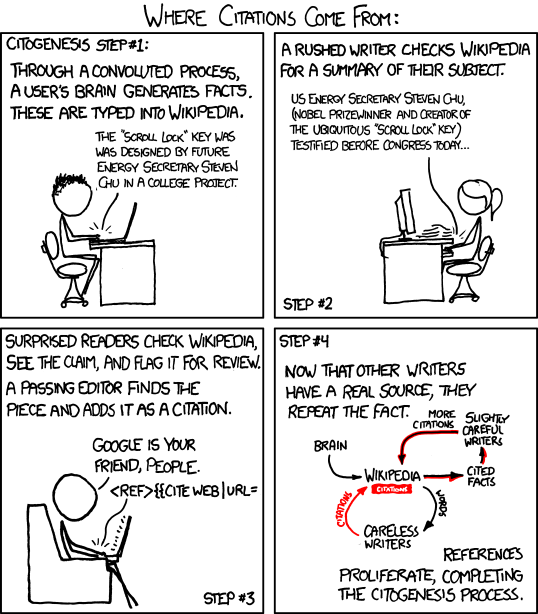
Even more extreme versions of this are those of mostly bad-faith “citogenesis” (a term coined by Randall Monroe in xkcd), where reliable sources are created for hoax Wikipedia content by means of circular reporting. For example, the name “Julius Pringle” for the Pringles mascot was made up by some Wikipedia editor but by 2013 was formally acknowledged and in fact adopted by Kellogg as the official name of their moustachioed figurehead (another thanks to Annie for pointing me to this one).
In the context of transit maps, the actual flattened diagram I made has no real-world counterpart, beyond the fact that yes, those stations do connect to each other in that order. It’s a diagram that has never been used in any form by the city of Montreal, but it’s still reliable and informative enough to be used on Wikipedia. The route diagram I made was actually submitted to the mainspace via Articles for Creation, which means it was formally reviewed by another editor before being approved (which isn’t strictly necessary). It doesn’t have any citations.
This isn’t to suggest it’s a bad faith contribution: Instead, it’s to acknowledge that this metro diagram lies in the gray area of tertiary information on Wikipedia.
Maybe, in a few years, I’ll board a Montreal metro car and look up to the ceiling to see the diagram I started emblazoned in paint. If I ever do end up seeing that… I know I’ll have truly made it, and wear citogenesizing a metro map into existence like a badge of honor.
Update, May 17 2023.